Are we richer or poorer than before the onset of the crisis?
Unpublished
(From ec.europa.eu)
The global financial crisis triggered a deep recession in 2008 and 2009, the deepest since the Great Recession of the early 1930s. In 2009, the EU's GDP dropped by 4.4%, and in 2014 it barely exceeded the level of 2008.
In terms of economic growth, the EU does seem to be experiencing a 'lost decade', after having experienced an average annual GDP growth of 2.29% between 1990 and 2007 and 2.45% during the six years preceding the crisis (2001-2007). According to Eurostat, GDP per capita in the EU28 was € 27 400 in 2014, which in real terms is 99% of the value in 2007, the year preceding the crisis.
EU vs. other world regions
The EU has done worse than other world regions. In 1990, the EU economy accounted for 25.5% of global GDP or 39.2% of the GDP of the world's big economic players (EU, Arab countries, China, India, Japan and USA). 25 years on, in 2014, the EU's share has fallen to 17% and 25.6% respectively. In 1990, the EU's GDP equalled 128% of US GDP; by 2014, it has decreased to 106%.
GDP growth differences across EU countries
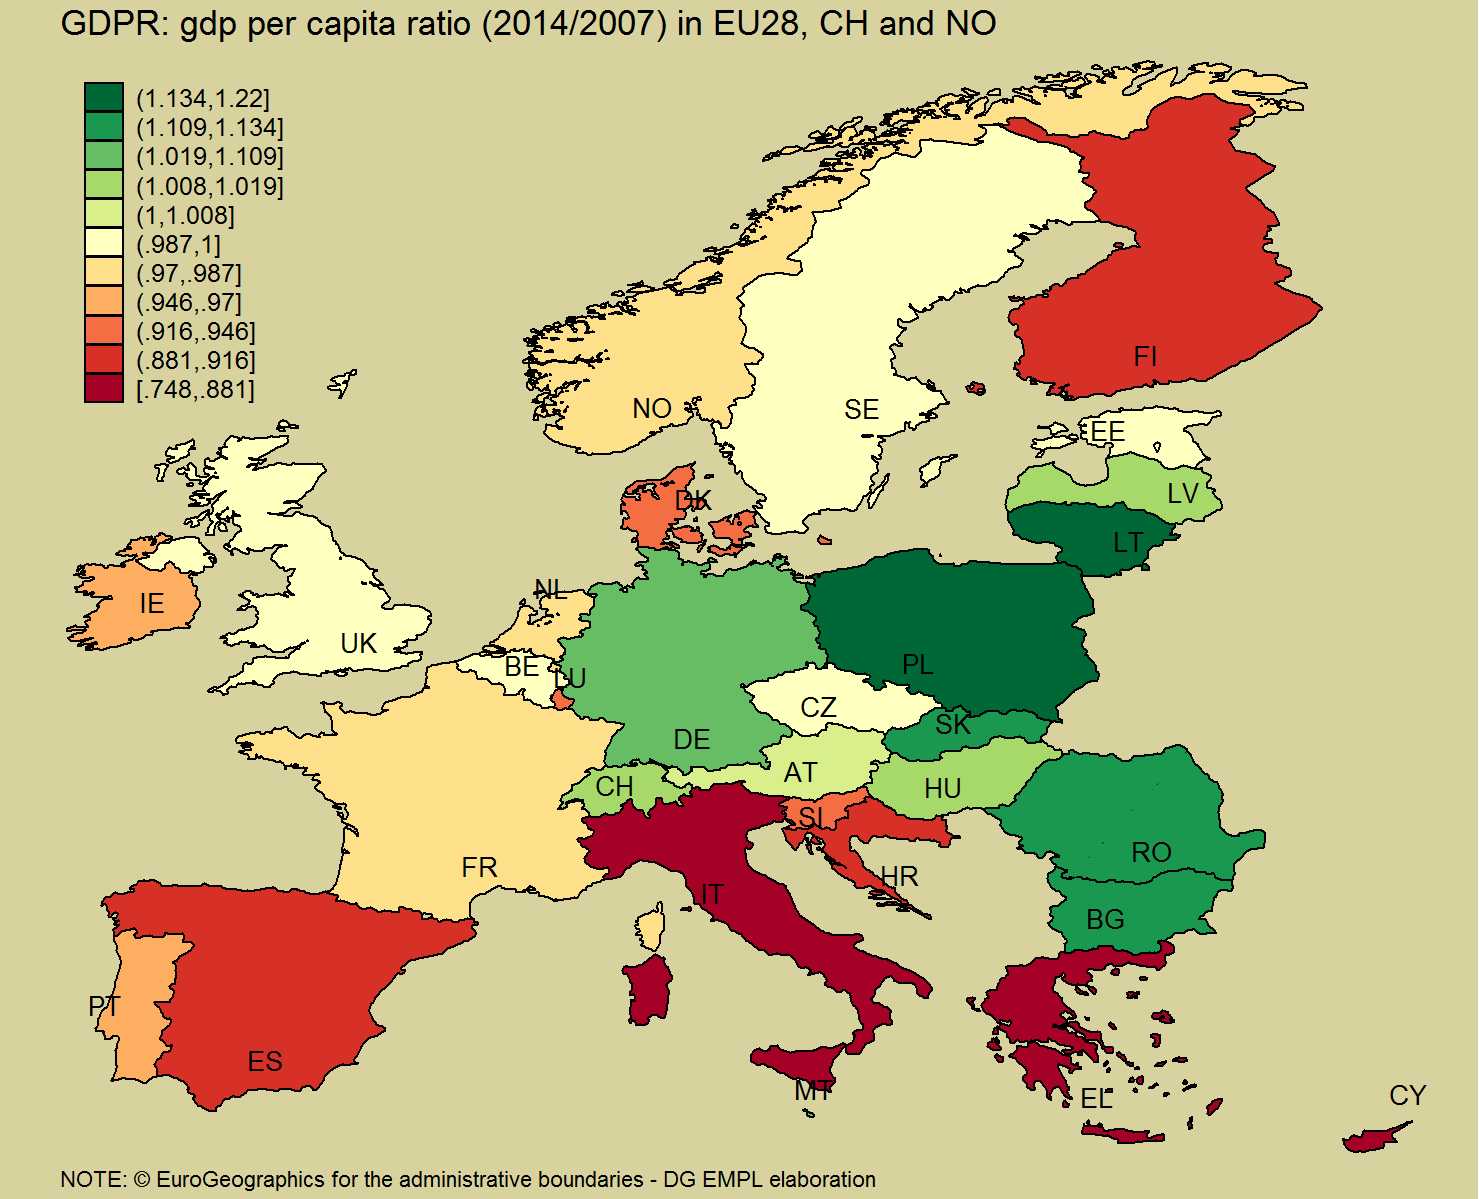
These aggregate data for the EU hide major differences across the Member States, as can be seen on the map below.
 The map shows the ratio between real GDP per capita in 2014 and 2007, grouping the values into 11 intervals. Dark green signals a strong increase in GDP per head; dark red a strong decrease. A value of 1 indicates that the country has not grown at all since the crisis; values below 1 mean that a country has still not recovered the pre-crisis level of economic performance.
Many Eastern European countries have made progress and managed to continue their catching-up process. Poland shows the highest increase in its GDP per capita (1.22, or +22%), followed by Lithuania (1.142), Slovakia (1.134), Romania (1.131) and Bulgaria (1.122).
On the other hand, there are three countries where GDP per capita in 2014 is less than 90% of its level in 2007: it dropped by as much as 25% in Greece (0.748), 17% in Cyprus (0.83) and 12% in Italy (0.881).
Link between GDP per capita and jobs
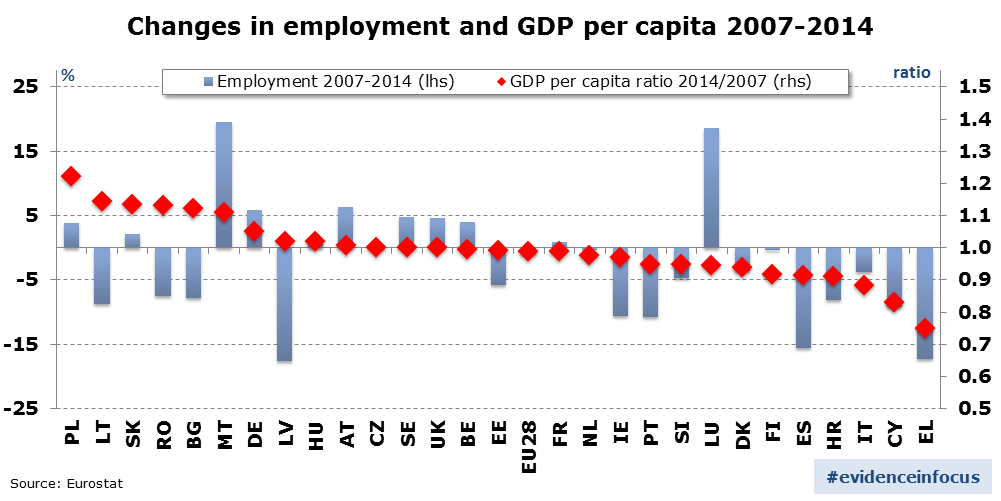
The economic crisis has also affected the labour market, destroying about 6.7 million jobs between 2008 and 2013. The chart below presents the information on GDP per capita alongside the change in total employment.
Not surprisingly, many countries with a sharp drop in GDP per capita also have suffered big job losses. However, the link between GDP per capita and jobs is not straightforward. Countries with a similar change in their GDP per capita can have very different employment performances, as the comparison between Finland and Spain, between Ireland and the Netherlands or between Latvia and Hungary shows.
Job losses have led to increased unemployment. In Greece, the unemployment rate exceeded 25% in 2014, whereas, in 2007, it was lower (8.4%) than in Germany (8.5%). In Spain, too, unemployment rose to close to 25%. Germany, Poland and Malta are the only countries where the unemployment rate fell below the level in 2007.
For an in-depth reflection on the relationship between GDP growth and job creation see the forthcoming analysis on "Okun's law in Europe" in the "Analytical web note series" by DG EMPL.
Author: G. Piroli works in the unit 'Thematic Analysis' of DG EMPL.
The views expressed in this article are those of the authors and do not necessarily reflect the views of the European Commission.
Editor's note: this article is part of a regular series called "Evidence in focus", which puts the spotlight on key findings from past and on-going research at DG EMPL.
